Tableau
Beauty and Big Data: Tableau
Tableau
Download Tableau in order to use notebooks available on our github.
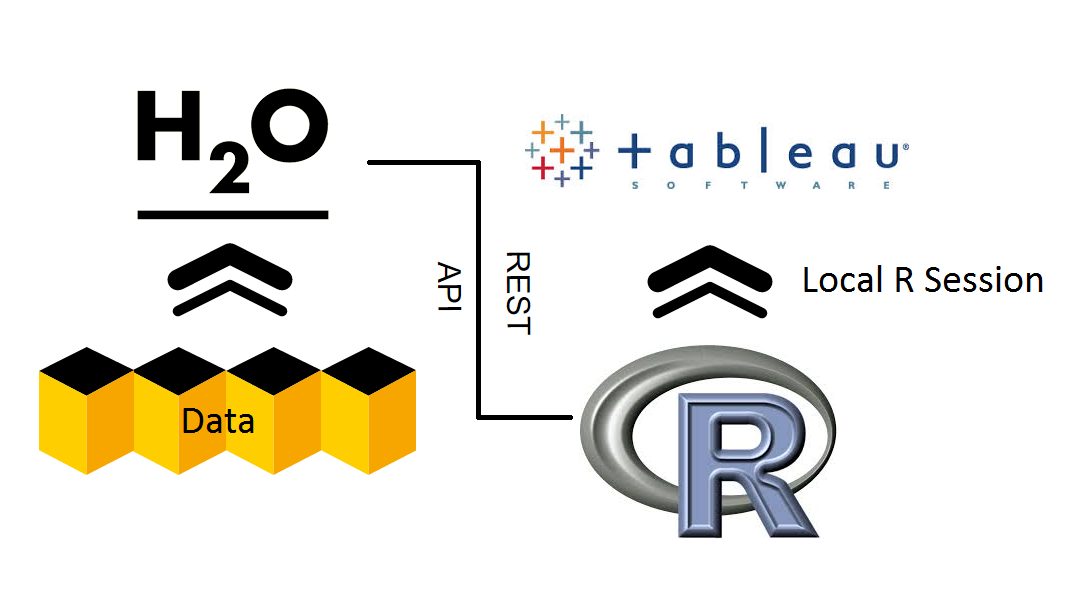
How does Tableau play with H2O?
Tableau is the frontend visual organizer that utilizes all the available statistic tools from open source R and H2O. Tableau will connect to R via a socket server using a library package already built for R. The H2O client package available for installation allows R to connect and communicate to H2O via a REST API. So by connecting Tableau to R, Tableau essentially can launch or initiate H2O and run any of the features already available for R.
R Component
First, make sure to install H2O in R:
> install.packages("h2o")
Then install the Rserve package in R that will allow the user to start up a R session on a local server that Tableau will communicate with:
> install.packages("Rserve")
> library("Rserve")
> run.Rserve(port = 6311)
Tableau Front End
Step 1: Connection Setup
Open Demo_Template_8.1.twb which should have all the calculated fields containing R script already in the sidebar.
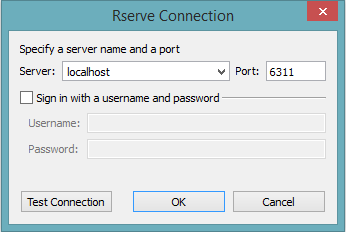
Navigate to “Help > Settings and Performance > Manage R Connection” to establish a connection to the R serve.

Input for IP: 'localhost' and for port: '54321'
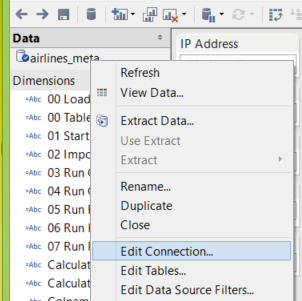
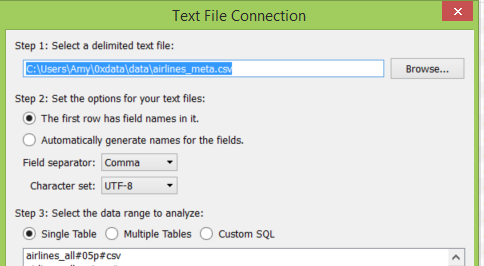
Step 2: Data Connection
Set the workbook’s connection to the airlines_meta.csv data by navigating to the data section on the left sidebar, right clicking on the airlines_meta and choosing to “Edit Connection.”
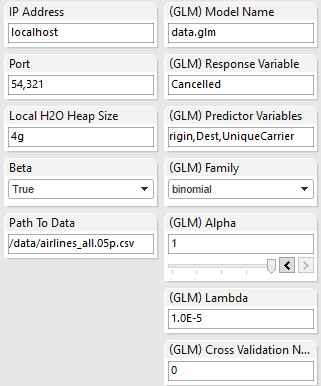
Step 3: H2O Initialization
Configure the IP Address and Port that H2O will launch at as well as the path to the full airlines data file.
Step 4: Data Import
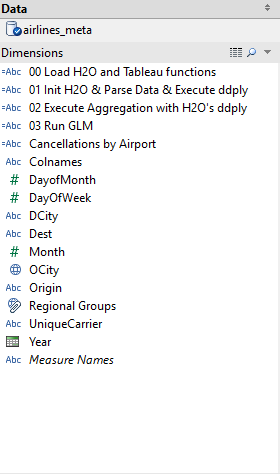
Execute “00 Load H2O and Tableau functions” to run:
> library(h2o)
> tableauFunctions <- functions(x){
> ...
> }
> print('Finish loading necessary functions')
Execute “01 Init H2O & Parse Data” to:
> library(h2o)
> localH2O = h2o.init(ip = "localhost", port = 54321, nthreads = -1)
> data = h2o.importFile(localH2O, "/data/h2o-training/airlines/allyears2k.csv")
Execute “02 Compute Aggregation with H2O’s ddply” to groupby columns and do roll ups. First calculate the number of flights coming and going per month:
numFlights = ddply(data.hex, 'Month', nrow)
numFlights.R = as.data.frame(numFlights)
Then compute the number of cancelled flights per month:
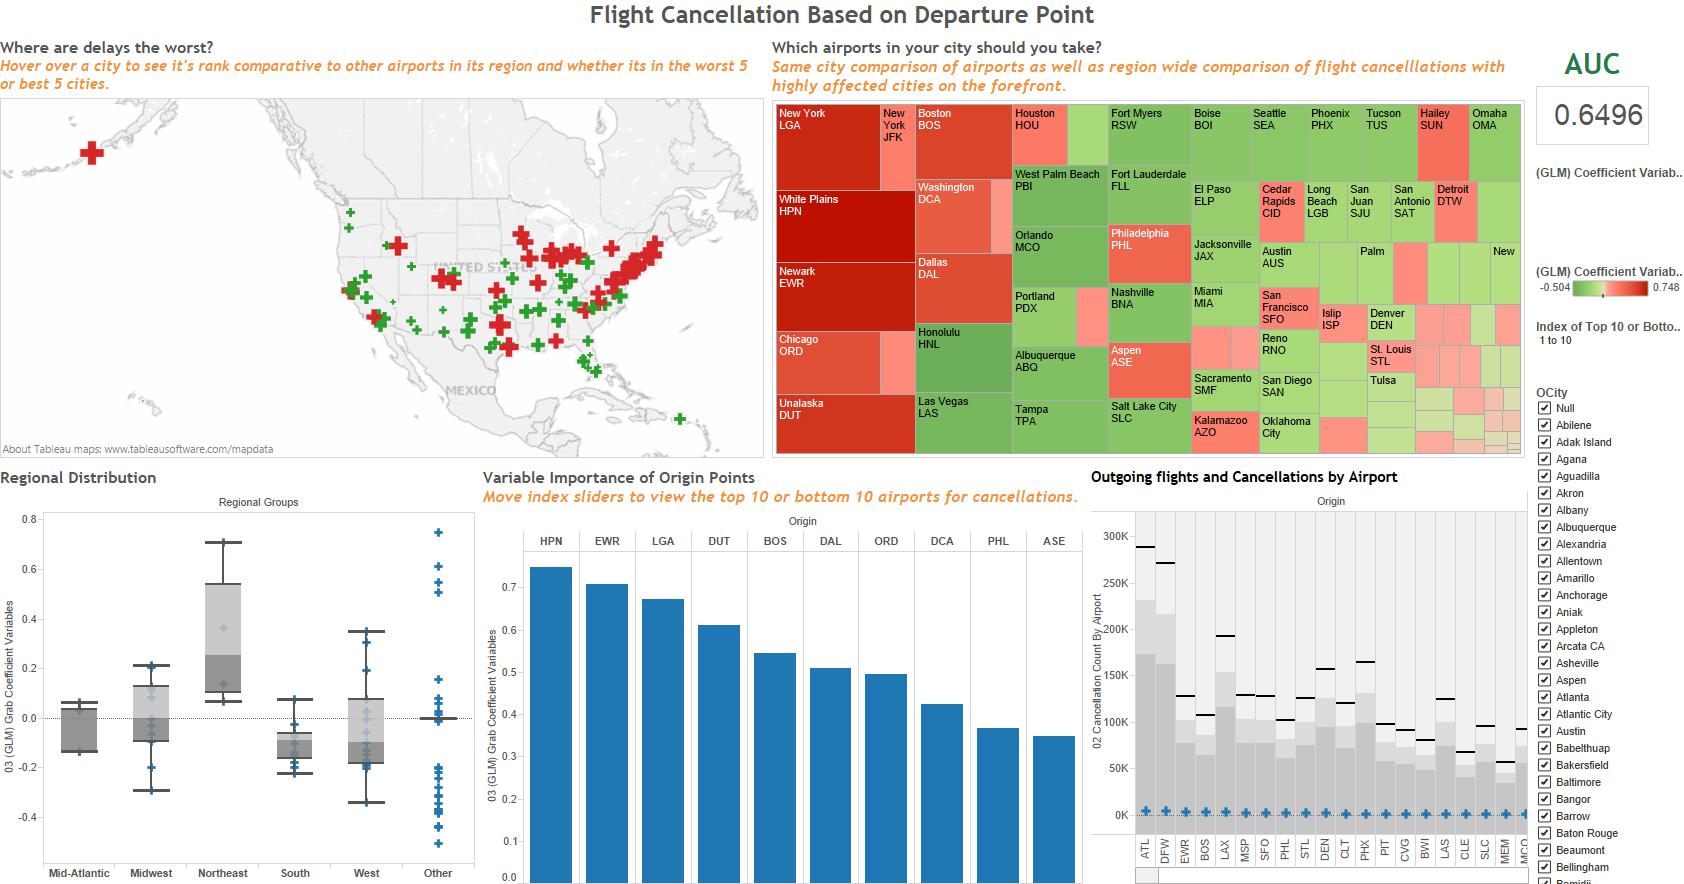
fun2 = function(df) {sum(df$Cancelled)}
h2o.addFunction(h2oLocal, fun2)
canFlights = ddply(data.hex, 'Month', fun2)
canFlights.R = as.data.frame(canFlights)
Execute “03 Run GLM” to build a GLM model in H2O and grab back coefficient values that will be plotted in multiple worksheets:
data.glm = h2o.glm(x = c('Origin', 'Dest', 'Distance', 'Unique Carrier') , y = 'Cancelled', data = data.hex, family = 'binomial', nfolds = 0, standardize=TRUE)After the calculated fields finishes running, scroll through the different dashboards to see data differently.